Multiple descriptions from different sources
There are multiple descriptions from different sources of information for this entity
Identification of the property
Country/State Party
Austria
State/Province/Region
Lower Austria, Upper Austria, & Styria
Name
Two separate locations:
Geographical co-ordinates and/or UTM
[This item will not appear publicly for the combined entity: only for the two constituent parts]
Maps and plans,
showing boundaries of property and buffer zone
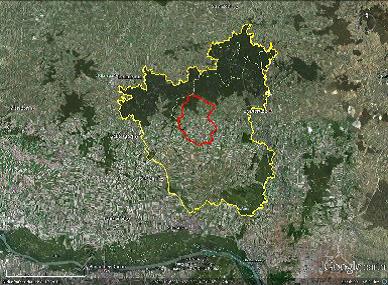
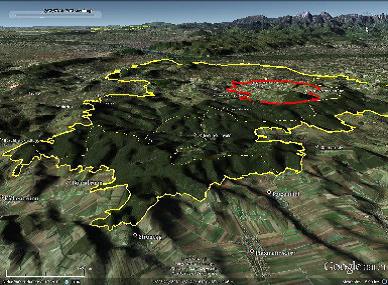
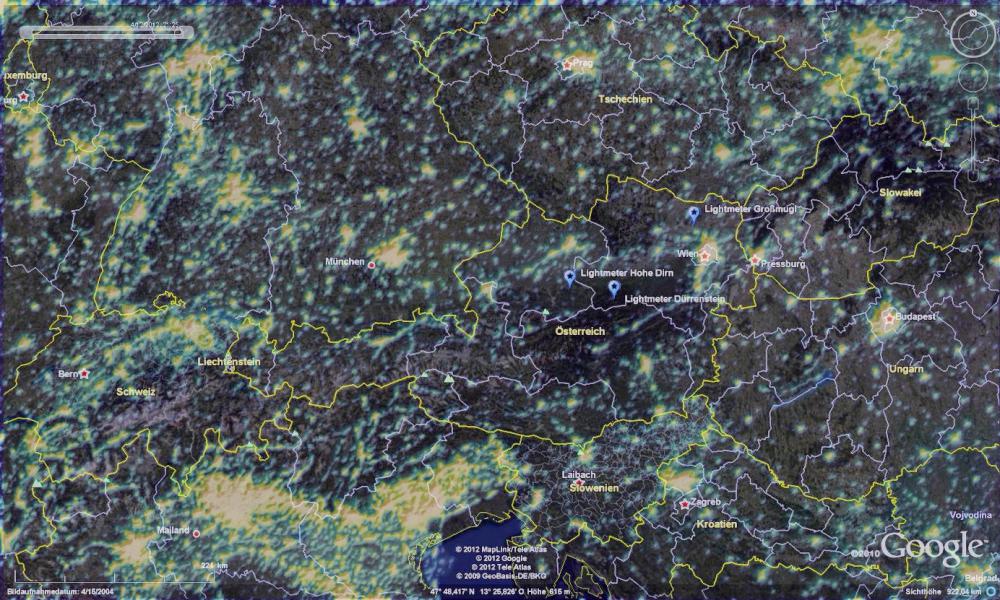
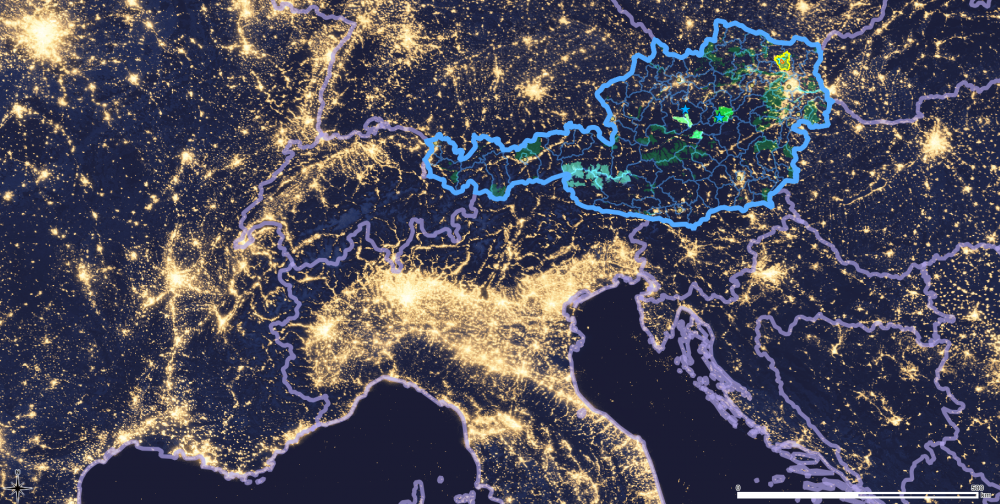
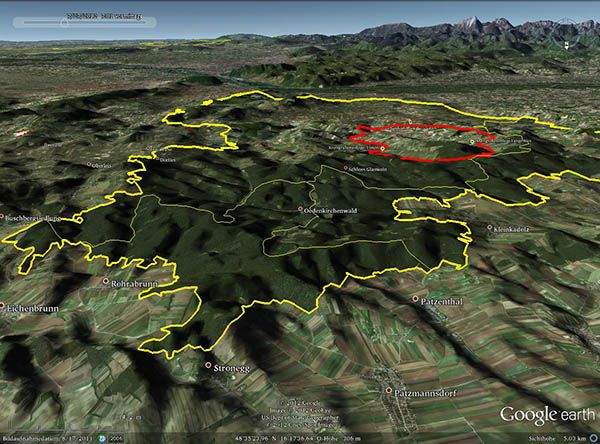
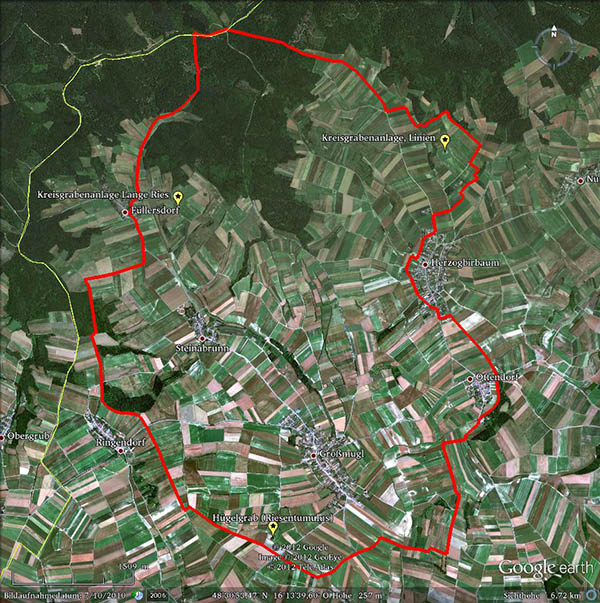
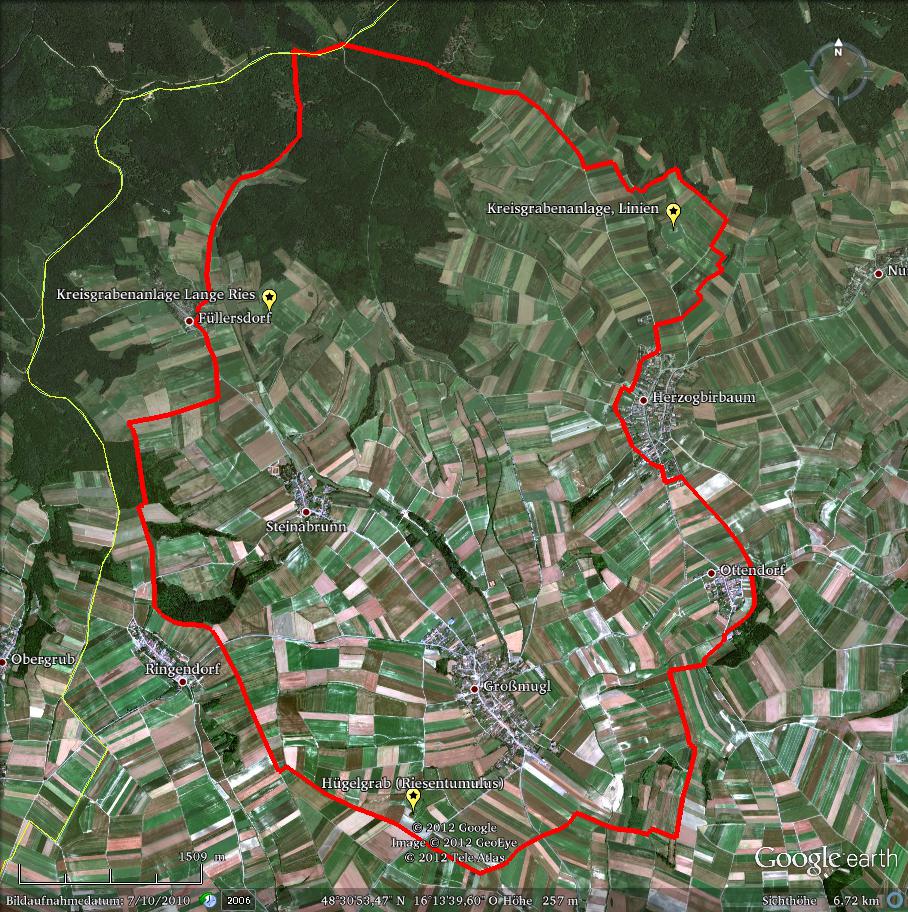
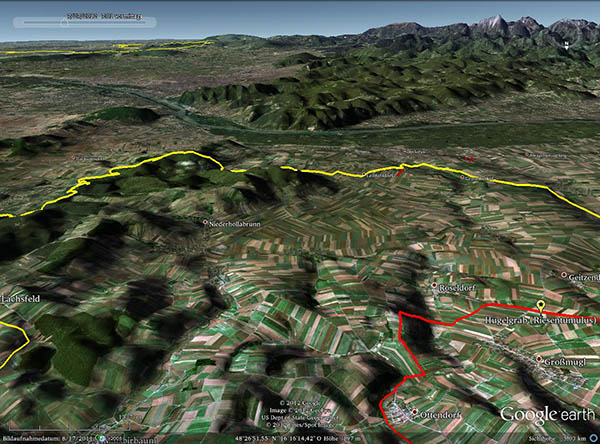
The picture below provides an overview of the Eastern Alps area containing the Eastern Alpine Starlight Reserve and the Großmugl Starlight Oasis.

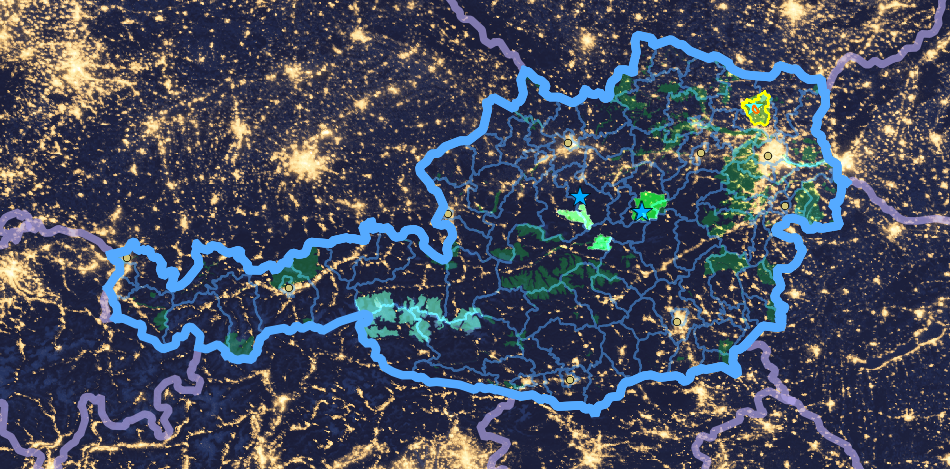
Fig. 1: The Alpine Arc and Central Europe at night. Top: Upward light from satellite measurements (background image), with state boundaries superimposed in purple, and the Austrian border highlighted in light blue. The bar at the lower right indicates 500 km. Bottom: Magnification of the part within Austria. Provincial boundaries are shown in blue. Bright green patches show the proposed Eastern Alpine Starlight Reserve cores and the Großmugl Starlight Oasis (with yellow boundary). Blue-green denotes additional IUCN category I and II protected areas in Austria, while dark green marks selected nature protection areas (for orientation). Blue stars denote light-monitoring stations that were set up for this study. They monitor light levels resulting from light shining downwards onto the sites. Chart and image: G. Wuchterl. Background image: NASA Black Marble.Area of property and buffer zone
[This item will not appear publicly for the combined entity: only for the two constituent parts]
Description
Description of the property
[This item will not appear publicly for the combined entity: only for the two constituent parts]
History and development
TO BE EDITED BELOW HERE
See remarks on the conservation areas that form the core zone and attached documents.
Justification for inscription
Comparative analysis
Integrity and/or authenticity
Criteria under which inscription might be proposed
Suggested statement of OUV
State of conservation and factors affecting the property
Present state of conservation
Factors affecting the property
Protection and management
Ownership
Protective designation
Means of implementing protective measures
Existing plans
Property management plan
Sources and levels of finance
Sources of expertise and training
Visitor facilities and infrastructure
Presentation and promotion policies
Staffing levels and expertise
Monitoring
Indicators for measuring state of conservation
Administrative arrangements
Results of previous reporting exercises
Documentation
Photos and other AV materials
TEMPORARY Other pictures and captions submitted
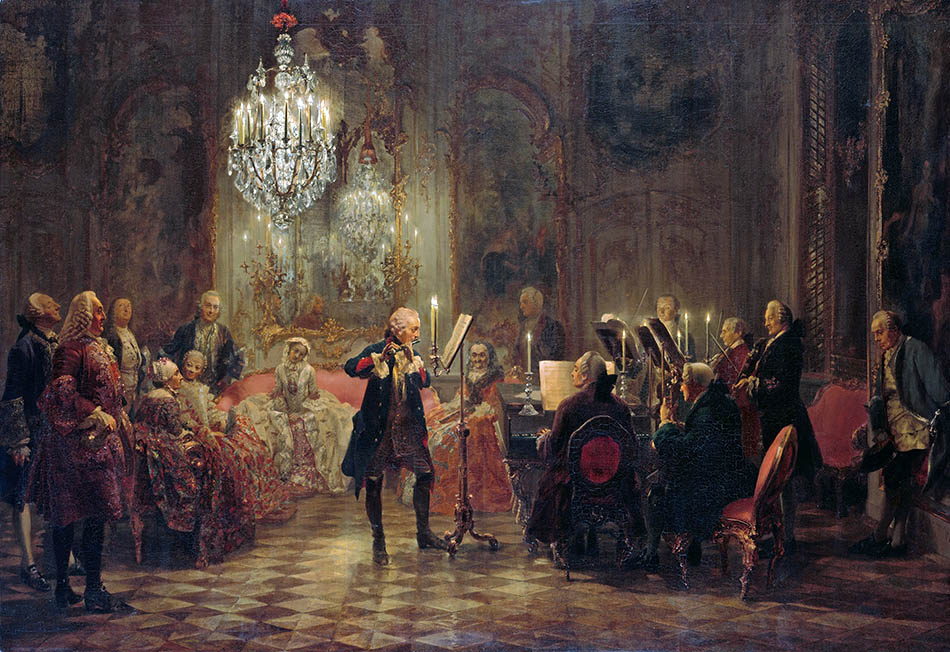
Fig. 6: 1852 painting of Friedrich II playing the flute under the ’crown-light‘, a symbol of ultimate luxury (light levels were 5 Lux measured in a recent
reconstruction experiment). Creative Commons license.

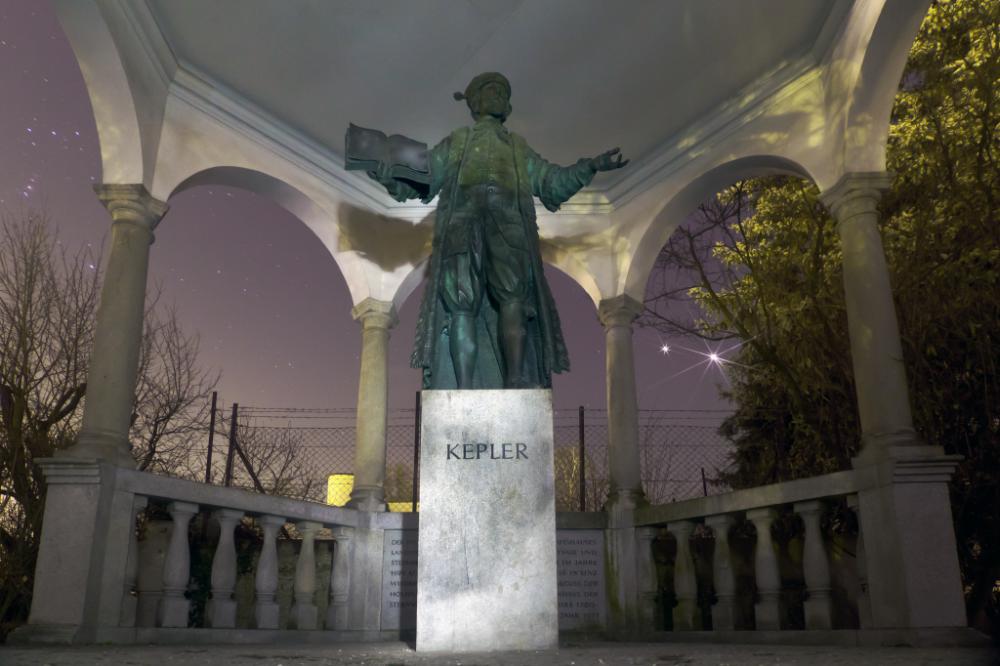
Fig. 7: Kepler at Linz. The bright planets Jupiter and Venus are readily visible to the right of the statue, but the perception of constellations is even compromised in the conspicuous case of Orion (to the left) under the urban conditions in the city of Linz. It is one of the values of a Starlight Oasis to conserve the authentic sky at a site as a monument of science of important epochs. Photograph: March 2012, Herbert Raab, Linzer Astronomische Gemeinschaft
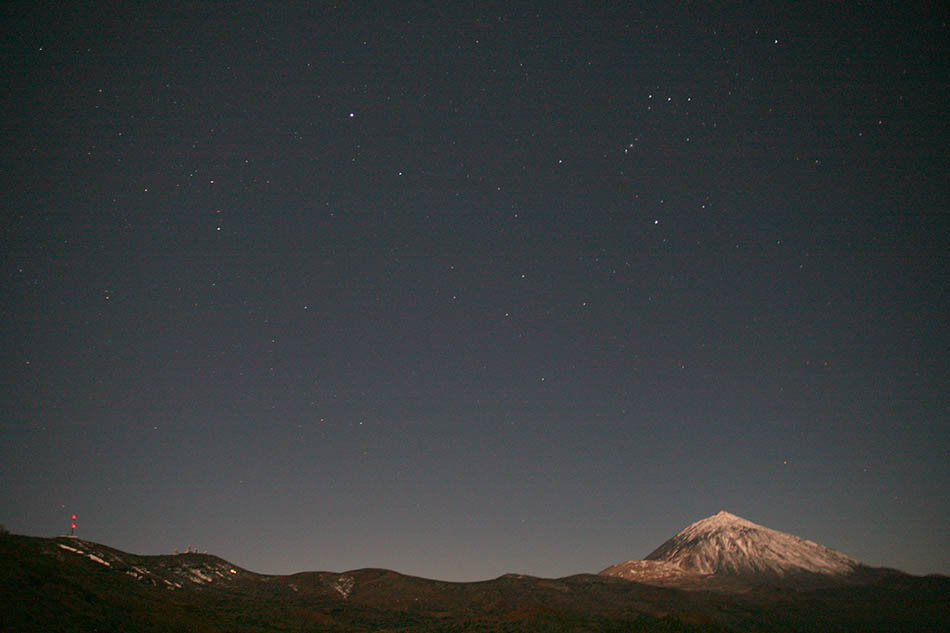
Fig. 8: An example of the role of colour at night: Pico del Teide (right) and the IAC’s Observatory (left) at Izaña, Tenerife in moonlight. Note the blueish sky with Orion and Sirius, the reddened moonlight on the snow-covered volcano and the greenish vegetation. Photograph © Alexandre Santerne
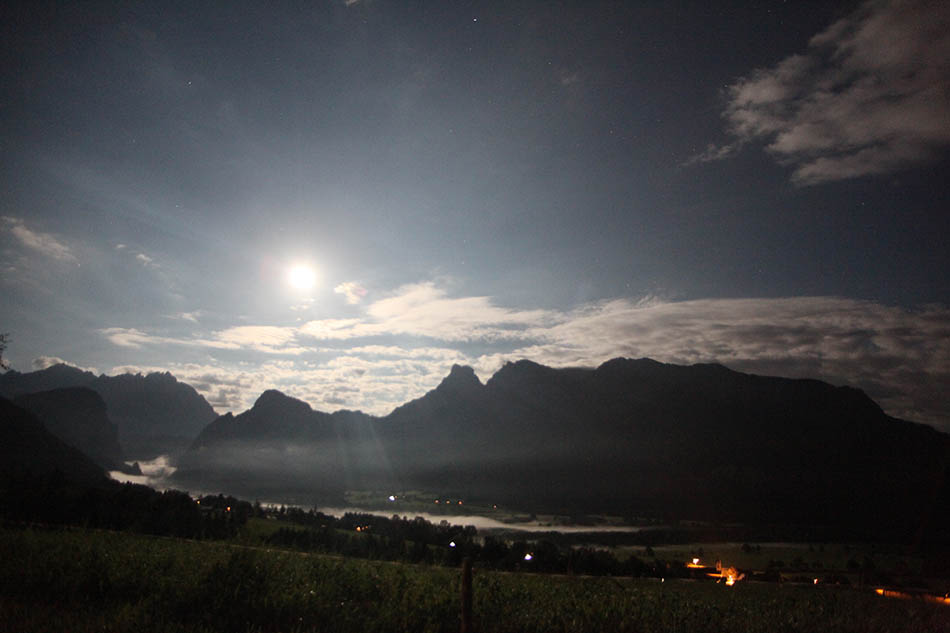
Fig. 9: The moon above Gesäuse National Park, showing the point where the River Enns emerges from the canyon (partly obscured by patches of mist) on the left.
The bright moonlight brings out colours in this image that are visible in a moderated way to the human eye in mesopic mode. Note the stars in the blue sky.
Photograph: Norbert Fiala
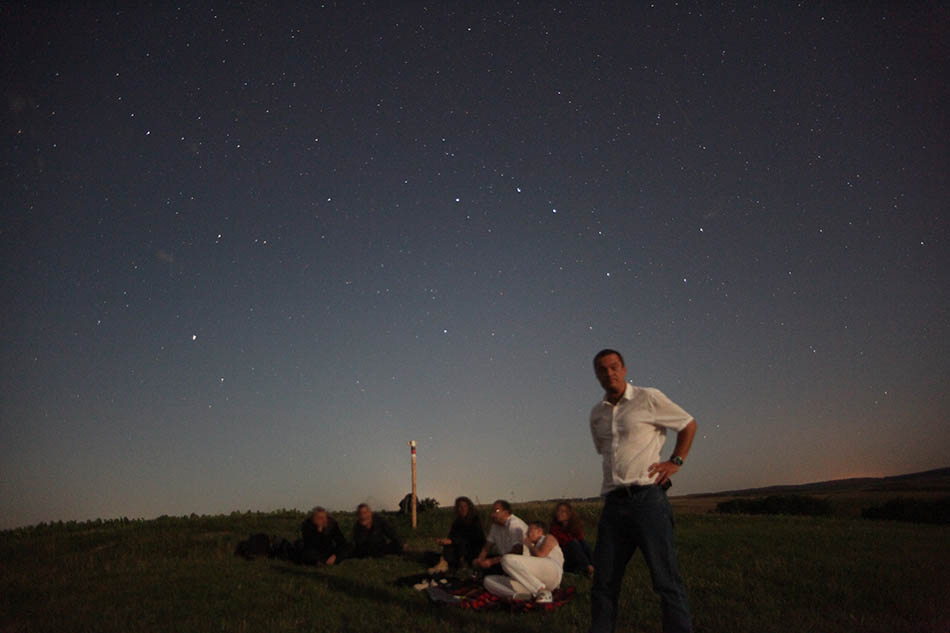
Fig. 10: Moonshine picnic at the tumulus observing site in the Großmugl Starlight Oasis. Note the colours of the sky, the green grass, the red in the blanket and marker and the long moon-shadow cast by the person in front. Photograph: Norbert Fiala
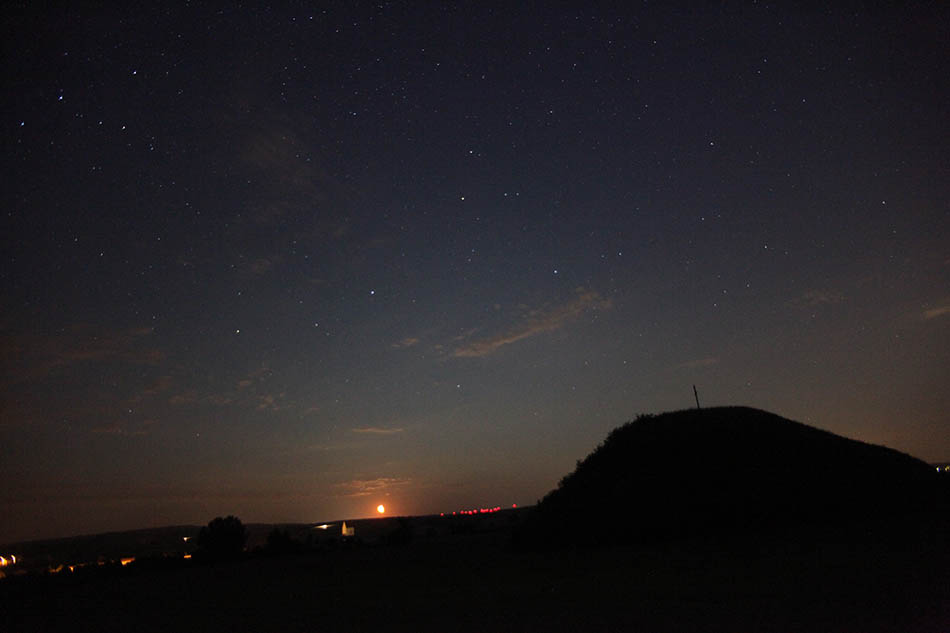
Fig. 11: Moonrise at Großmugl tumulus. Note the reddened moon, coloured clouds and blue sky with stars (Cassiopeia and Pegasus). The colours of the moon physically are the colours of the sun — same spectrum, same scattering: the moonlit night sky is as blue as during the day with the same shadow casting. Perceived through the human eye in mesopic/twilight mode, the unique moon-shine appearance is created: bluish colour tones and hard pitch-black shadows. Photograph: Norbert Fiala
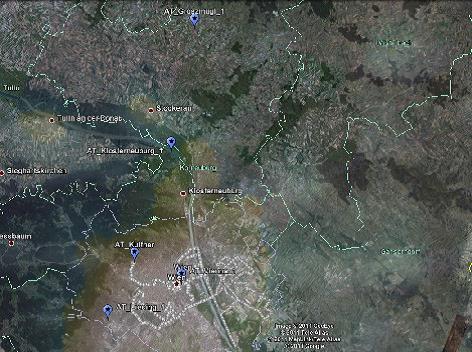
Fig. 12: Night-monitoring network that measures the Großmugl sky quality and allows evaluation of protective action. Light-meter sites that measure total radiation at 1 Hz continuously during day and night are marked by blue symbols. They are superimposed on a satellite map with colour-shaded light-data from measurements taken in 2009 by the Defence Meteorological Satellite Program. Image: DMS and A. Trawöger, kartenwerkstatt.atISSUE Poor picture quality; please provide replacement
ISSUE Written copyright permission needed from DMS
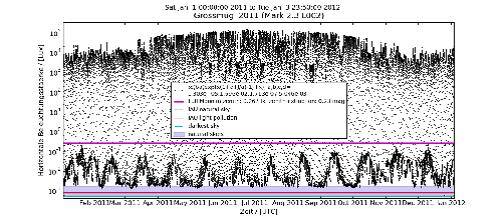
Fig. 13: One year of sky quality measured in the village of Großmugl (1 Hz down-sampled to 10 min). Favourable weather brings natural clear moonless night light conditions (blue-shaded). See text for details.ISSUE Poor picture quality; please provide replacement
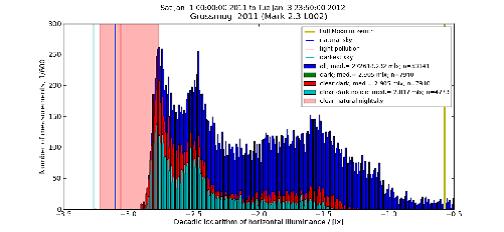
Fig. 14: Frequency of light conditions: one year of sky-quality in Großmugl. Using the same data as in Fig. 13, here the distribution of measurements is shown with respect to the logarithm of horizontal illumination. Large bins indicate conditions occurring frequently: the largest bins correspond to a duration of the respective conditions for of about 40 hours per year, the cumulated first peak to about 1000 h/year. Blue indicates all data, red indicates clear moonless nights, and cyan indicates ice-free, clear, moonless nights. Vertical lines indicate the values for the darkest sky ever measured (cyan), the IAU conventional value for the night-sky (blue) and the IAU limit for light pollution (red). The red shaded area gives a range of published natural sky measurements: the illumination due to the full moon at the zenith is marked by the yellow line at the right border of the graphic. The broad maximum on the left (dark side) corresponds to the most frequently occurring clear conditions around approximately a factor two above the IAU light pollution limit.ISSUE Poor picture quality; please provide replacement
Fig. 15: Bird’s-eye view of a February 2012 light-meter scan of the light-levels on the road network in the Großmugl Starlight Oasis buffer zone. Colours along the scanned streets denote light levels (logarithmic, black 0.03, dark blue 0.1, light blue 1, cyan 2.7, green 10, yellow 100 mW/m² (app. 1 Lux), orange 1, red 1.8 W/m², light blue and above indicates areas with lighting. Measurements of zenithal sky-brightness in the SQM system are given for reference (labelled lila markers). The core-zone at the giant tumulus is marked by its 21.15 mag/arcsec² SQM-reading. Outside the villages (not below lamps) light levels approach natural values within less then a 100m. The width of the area shown is ~20 km. (This email address is being protected from spambots. You need JavaScript enabled to view it. with colour-coding by Felix Linhardt)ISSUE Poor picture quality; please provide replacement
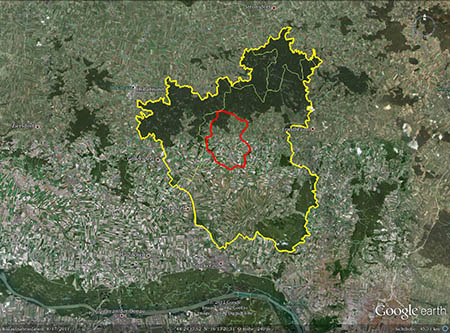
Fig. 16: Light levels (total radiation, blue to yellow colour coded following the street network, cf. Fig. 15 above) in the core zone of the Großmugl Starlight Oasis (red line). Prehistoric remains (yellow symbols) and supplementary SQM-measurements (violet symbols annotated with values in mag/arcsec²) as well as the position of the stationary light-meter that performs the continuous monitoring (blue symbol) are indicated. Zoom of Fig. 15.ISSUE Poor picture quality; please provide replacement
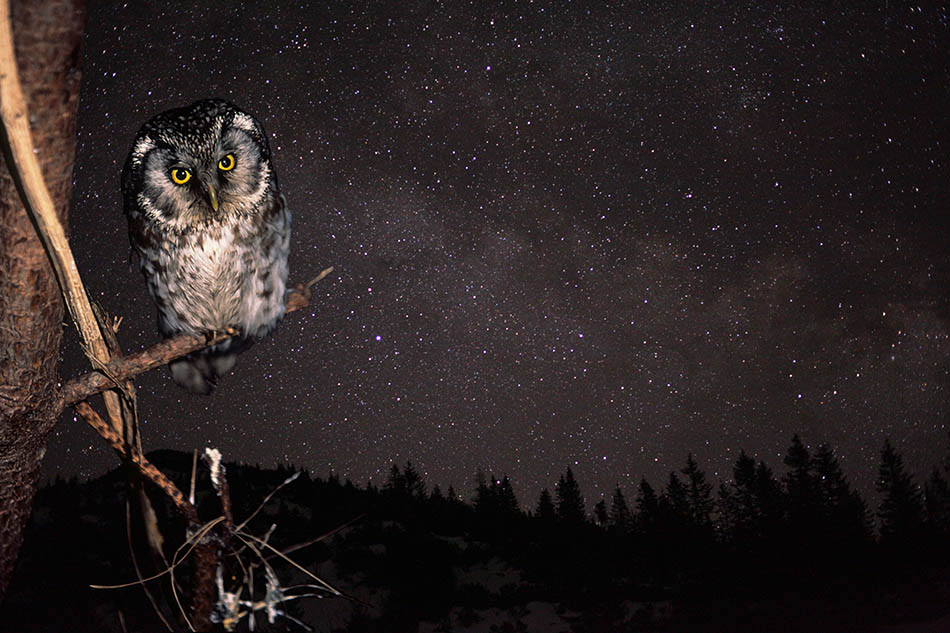
Fig. 17: The boreal owl (aegolius funereus, a precious nocturnal species) looking north together with the sky above its frequent hunting and nesting grounds in the Dürrenstein Wilderness Area. Image: P. Buchner, www.birdlife.at (owl), G. Wuchterl (stars), K. Einhorn (montage)ISSUE Written copyright permission needed
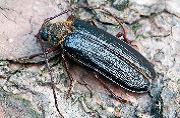
Fig. 18: Tragosoma despsarium (Zottenbock) — a species thought extinct but subsequently rediscovered in the Dürrenstein Wilderness. Photograph: DWAISSUE Poor picture quality; please provide replacement
ISSUE (1) "DWA" needs elaborating: who actually took the photograph? Or can we just say "Photograph © DWA? (2) Written copyright permission needed
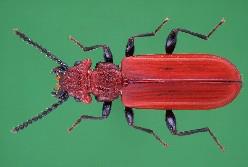
Fig. 19: Cucujus cinnaberinus, an example of an IUCN “endangered species” at home in the deadwood of the Rothwald primary forest in the Dürrenstein Wilderness Area. Photograph: DWAISSUE Poor picture quality; please provide replacement
ISSUE (1) "DWA" needs elaborating: who actually took the photograph? Or can we just say "Photograph © DWA? (2) Written copyright permission needed
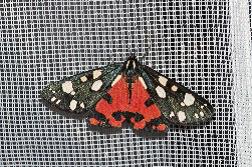
Fig. 20: Scarlet Tiger Moth (callimorpha dominula) — one of the many nocturnal moth species of the Dürrenstein Wilderness Area. Photograph: DWAISSUE Poor picture quality; please provide replacement
ISSUE (1) "DWA" needs elaborating: who actually took the photograph? Or can we just say "Photograph © DWA? (2) Written copyright permission needed
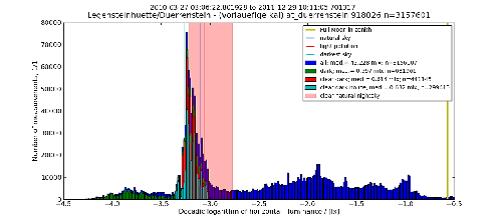
Fig. 21: Horizontal illumination determined by the light-meter at the Dürrenstein Wilderness Area at an elevation of 1500 m. The distribution of the night-brightness as derived from about 3 Mio measurements that were obtained since March 2010 is shown. The number of measurements at the ordinate are shown for the respective light level, specified by the decadic logarithm of the luminance in Lux, on the abscissa. Only levels below the full moon (yellow vertical line) are shown. Different colours mark different sky and weather conditions: blue: all measurements; green: dark skies, i.e. with the Moon at least 4° under the horizon (to avoid moonshine and lunar twilight); red: clear dark skies; cyan: clear dark skies and temperatures above 0 °C (a summer indicator and to detect any snow-effect). Vertical lines are shown for reference: the darkest sky measured (cyan); the value corresponding to the IAU conventional natural sky (blue); the IAU light pollution limit (10% above natural) (red line); the range of natural (solar-minimum) skies (pink shaded area) and the illumination corresponding to the full moon in zenith (yellow line). The peak of the distribution lies at the lower range of natural skies near the ’darkest sky‘ value. That is very similar to measurements in the Atacama desert (see the Großmugl Starlight Oasis extended case study), i.e. the illumination provided by natural skies. Some differences are apparent in the right wing of the peak, especially in the blue (all weather) and tails towards the bright and dark, possibly natural values combined with moon-shine on clouds on the bright side and very dark overcast moonless nights on the faint side. Note the similarity to the Atacama skies and the differences to the Großmugl Oasis.ISSUE Poor picture quality; please provide replacement
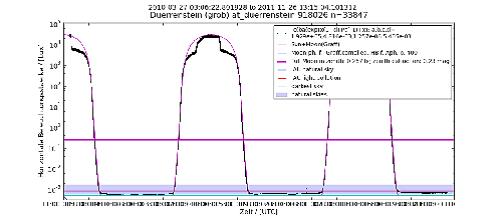
Fig. 22: Light levels at the Dürrenstein light-meter site during a high-pressure situation leading to high-altitude fog covering the pre-Alpine lowlands and most valleys. Under these perfect conditions — dry atmosphere above and cloud cover below, over central Europe — some of the darkest values recorded for any skies have been obtained. The horizontal illuminance in Lux is plotted logarithmically as a function of time (UTC). The magenta line is a model of natural light. Results from three days and nights are shown.ISSUE Poor picture quality; please provide replacement
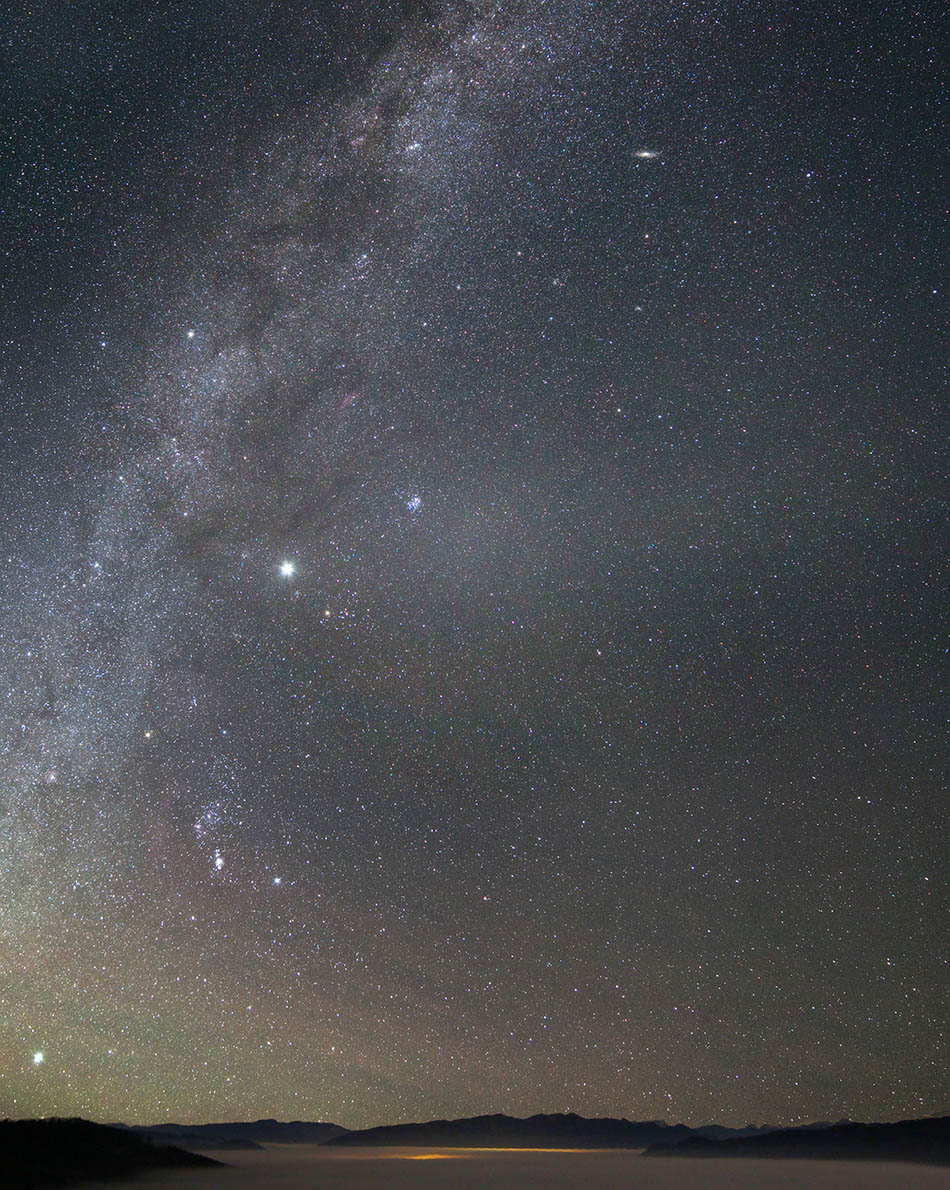
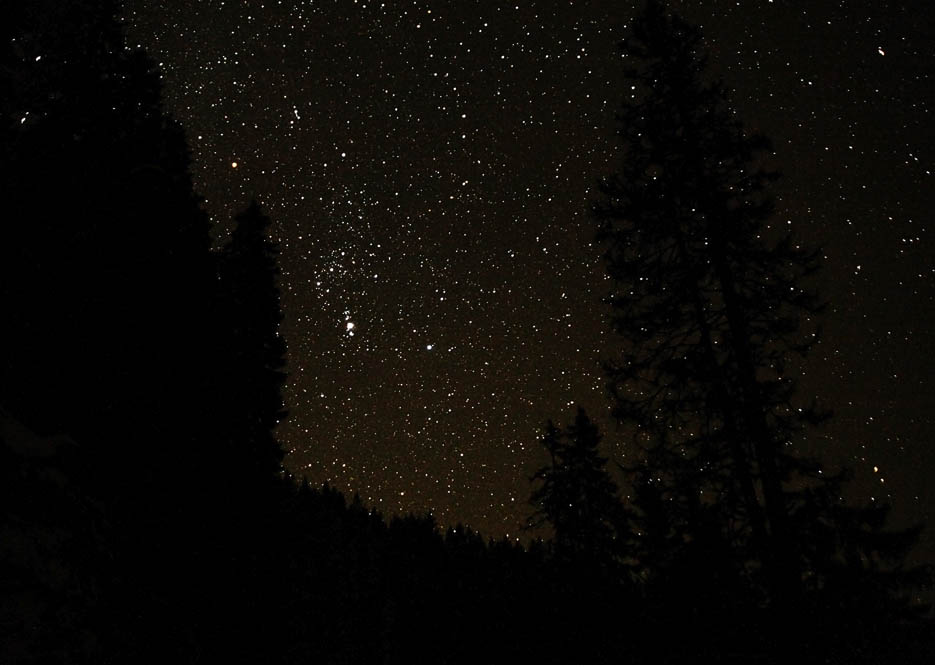
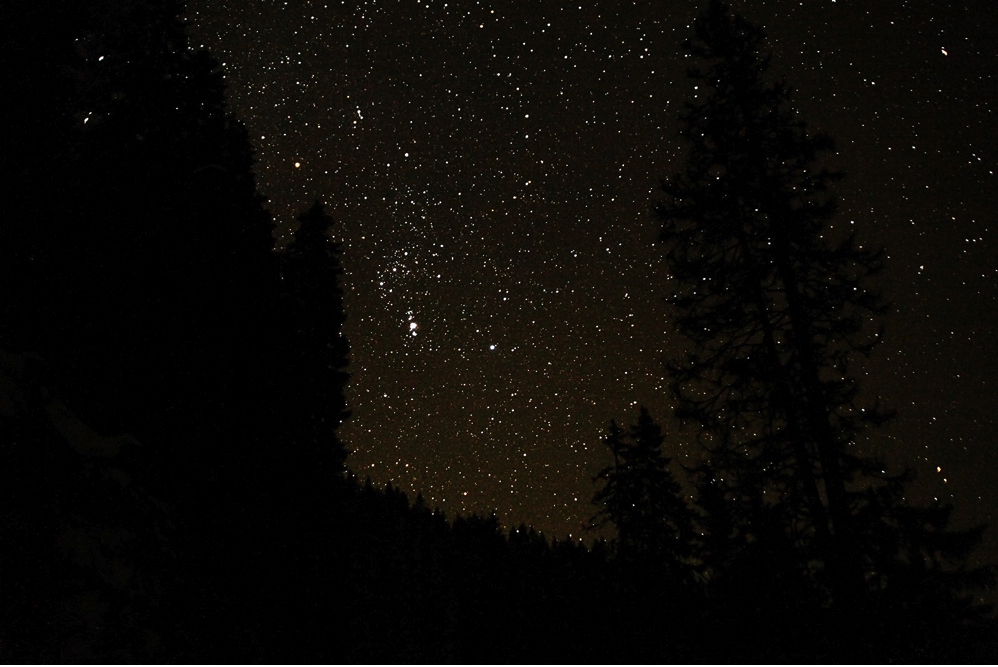
Fig. 23: Gegenschein in the zodical band (centre) in the Eastern Alpine Starlight Reserve above the Kalkalpen National park as seen from the “Hohe Dirn” (1000m). The Milky Way is rising on the left. Photograph: R. Dobesberger, Sternfreunde SteyrTexts relating to protective designation
Most recent records or inventory
Agencies holding inventory records
Bibliography


 ICOMOS - IAU case study
 IAU extended case study